

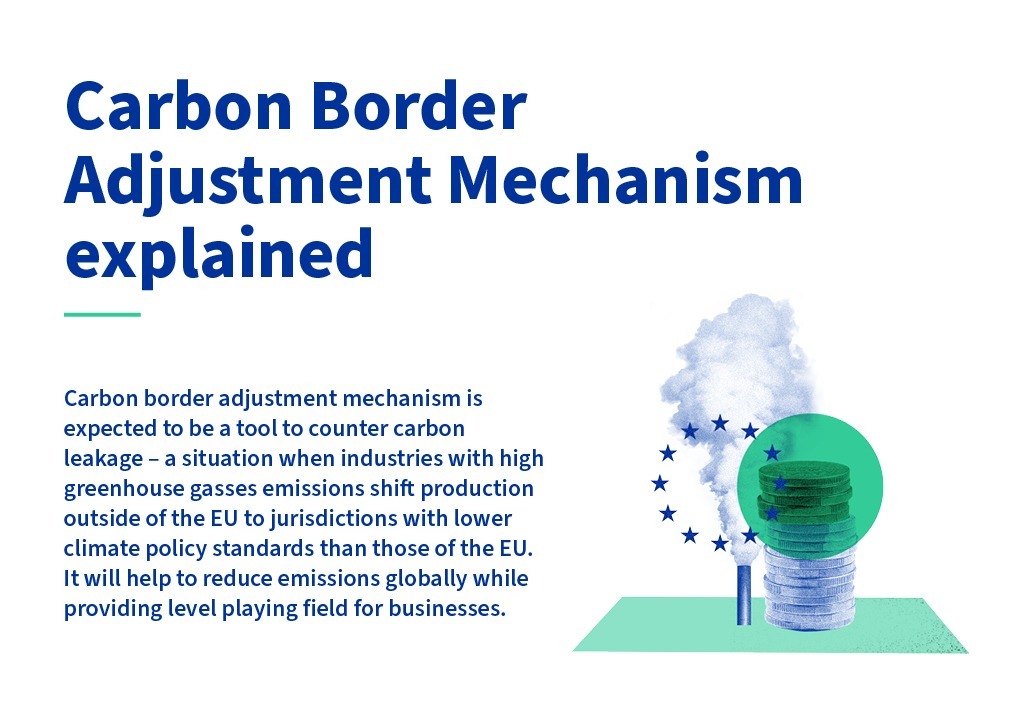
The EU's Carbon Border Adjustment Mechanism is now entering its final stage.
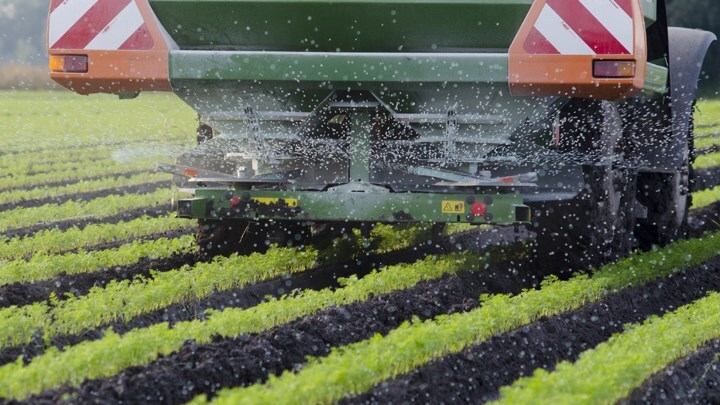
Although CBAM is still in the transitional stage, which began on October 1st, 2023, this will come to an end on December 31, 2025. At that point, businesses importing CBAM-covered goods, including iron & steel, aluminium, cement, fertilisers, hydrogen, and electricity, will have to comply with CBAM’s regulations to continue importing goods into the EU.
For businesses that haven’t yet put into place a strategy for fulfilling their reporting obligations, it’s essential to begin collecting emissions data ready for submission now.
At CFP Energy, we've been helping companies set up reporting systems from CBAM’s start – streamlining the shifting demands of compliance through expert, tailored advice. To discuss your reporting needs, or to access CBAM certificates, contact our carbon team today.
Navigating the Hurdles of Your First CBAM Report
CBAM is currently in its transitional phase, whereby you must submit your CBAM reports every quarter. From 1st January 2026, the full Carbon Border Adjustment Mechanism will be in effect. Annual declarations will be required, and you must be CBAM-authorised to import the goods or make declarations.
CBAM Reporting Requirements
CBAM reports need detailed import information: quantity, country of origin, and the specific production site. This level of detail matters because carbon intensity varies between individual plants, not just countries. Requirements include:
Registration
Importers first need to register in the CBAM Transitional Registry. This can be accessed through the CBAM Portal, which is where all compliance and reporting steps are outlined.
Direct Emissions
This refers to CO2 emissions generated in the manufacturing of CBAM-covered goods. This includes emissions from the production of heating and cooling that are consumed during the production processes, irrespective of whether the heating or cooling was produced on or off-site.
Indirect Emissions
Under CBAM, indirect emissions refer to carbon emissions produced in the use of electricity in the manufacturing of the covered products. At present, only cement and fertilisers will be subject to carbon pricing based on indirect emissions. All other goods (aluminium, iron & steel, hydrogen) won’t be subject to indirect emissions pricing, although they must still report them.
Verification of Data
Under CBAM rules, emissions data must be verified by organisations accredited through services that are members of the International Accreditation Forum (IAF). Verification of emissions data will also require accredited verification bodies to conduct physical inspections of facilities and ensure compliance with verification requirements.
Quarterly Reporting
During the transitional period, declarants are required to submit quarterly CBAM reports detailing their embedded emissions. From January 1st, 2026, when the transitional period ends, declarants will be required annually and will have to purchase and surrender CBAM certificates.
Greenhouse Gas Emissions (GHG)
CBAM reports must include both direct and indirect greenhouse gas emissions. Emission levels can vary considerably from product to product, and sometimes for the same product. Hydrogen, for instance, comes in at least 4 different types, each with its own carbon footprint.
Actual Emissions
As of this year, declarants are no longer allowed to submit default values. To prevent underreporting and ensure fair carbon pricing, importers must now submit their actual embedded emissions. Exemptions to this rule only apply for complex goods, such as white Portland cement, where multi-stage production chains make actual CO2 emissions difficult to trace.
For a broader overview of CBAM, see our CBAM Explained article.
Calculating CBAM Emissions by Product
All CBAM products follow this basic formula of Embedded Emissions = Direct Emissions + Indirect Emissions. At present, CBAM defines indirect emissions narrowly, meaning that typical Scope 3 emissions, such as transport and waste management, are excluded. Only electricity used within production counts as an indirect emission under CBAM, making the process of emissions calculation much simpler.
However, while CBAM’s narrow interpretation of indirect emissions reduces the work in recording and calculating Scope 3 emissions, difficulties remain. Due to the extensive range of goods covered under CBAM, standard emissions tracking isn’t possible. Each product has its own emissions footprint, which means that each product has its own reporting requirements.
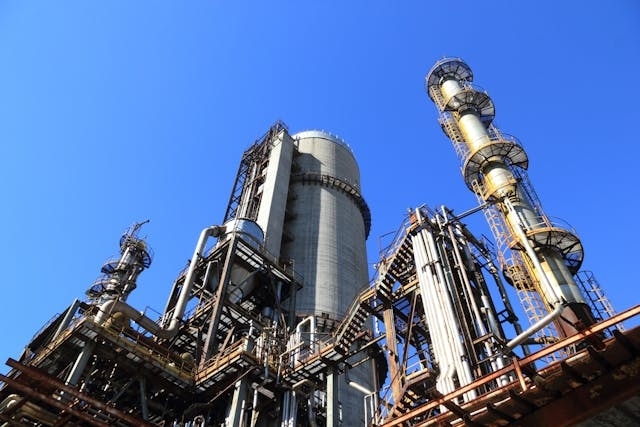
What is CBAM steel?
Steel faces the most complex emissions calculations under CBAM due to multiple production chains. The primary challenge lies in tracking emissions through integrated production routes that might incorporate a range of different methods. From blast furnace-basic oxygen furnace (BF-BOF) to electric arc furnace (EAF) methods, the diversity of production methods in steel manufacturing can make it a difficult good to assess. To meet this challenge, the IEA recommends robust data collection methods.
Steel Emissions Profile
Direct emissions (60-80% of total)
This figure is made up of emissions directly related to steel production. This includes blast furnaces, electric arc melting, and fossil fuels (e.g., natural gas) used to heat or melt iron.
Indirect emissions (20-40% of total)
The indirect emissions of electricity relate to all the energy used for processes within the plant that aren’t directly related to the production process itself; these include lighting, heating, and ventilation systems.
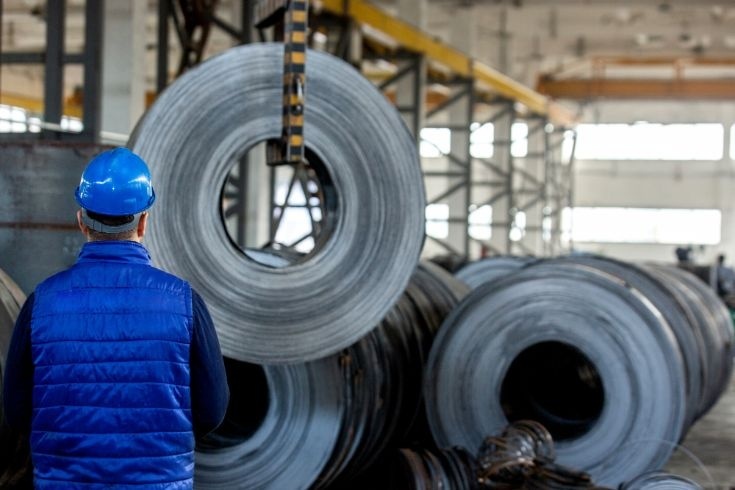
Key Challenges Unique to Steel
- Production route complexity: Different methods (BF-BOF vs EAF) produce vastly different emission profiles
- Multi-stage processes: Emissions must be tracked through sintering, coking, ironmaking, and steelmaking stages
- Scrap metal accounting: Recycled content reduces emissions but requires careful allocation
- Precursor materials: Emissions from intermediate products (pig iron, crude steel) must be properly attributed to final goods
Is Cement Covered by CBAM?
Cement production is also covered under CBAM. However, it faces a number of unique challenges. These include its reliance on clinker, which, because of the high temperatures required for its production, can prove hard to decarbonise with fossil fuel alternatives. Reducing production emissions like these poses the biggest obstacle for cement makers, with indirect emissions making up only 5-15% of total emissions by comparison.
Cement Emissions Profile
Direct emissions (85-95% of total)
Compared to other CBAM-covered goods, the direct emissions of cement make up almost the entire sum of cement’s footprint. This high figure is largely due to the high-intensity process of limestone calcination, which is endothermic, and comes to around 60% of the total.
Indirect emissions (5-15% of total)
Electricity used in processing new materials, operating kilns, and cement milling operations contributes to this figure.
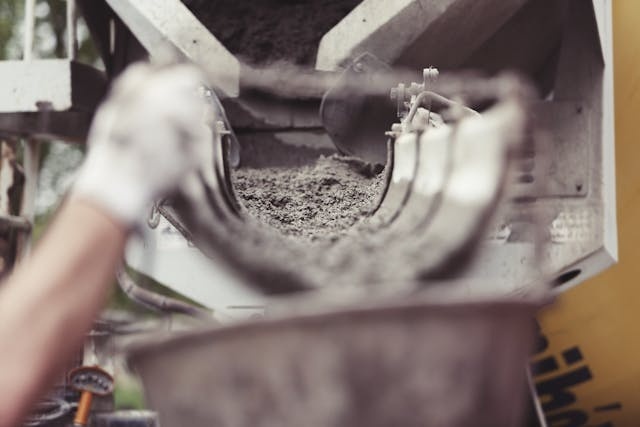
Key Challenges Unique to Cement
- Unavoidable process emissions: Limestone calcination releases CO₂ as part of the chemical reaction (CaCO₃ → CaO + CO₂), regardless of fuel source
- Clinker content determination: The clinker-to-cement ratio is the single most important factor in emissions intensity
- Blended cement variations: Different formulations using supplementary cementitious materials (SCMs) create varying emission profiles
- Alternative fuel complexity: Calculating emissions from mixed fuel sources (fossil fuels, biomass, waste-derived fuels) requires detailed tracking
CBAM Aluminium Scope
The scope of aluminium within CBAM is initially limited. Aluminium production requires large amounts of electricity, particularly during the electrolysis stage, which results in a carbon footprint dominated by indirect emissions - accounting for around 60% of the total carbon footprint. However, in the transitional phase, the EU has excluded indirect emissions linked to electricity consumption from its carbon cost calculations.
Aluminium Emissions Profile
Direct emissions (20–40% of total)
Aluminium’s direct emissions are mainly derived from the smelting stage. Additional emissions are produced from burning fuels, such as natural gas and coal, that are typically used in processes like aluminium casting.
Indirect emissions (60-80% of total)
The electrolysis process, the main process in aluminium production, is heavily dependent on electricity. Electrolysis can use 13–15 MWh of electricity per tonne of aluminium, which accounts for this good’s particularly high percentage of indirect emissions.
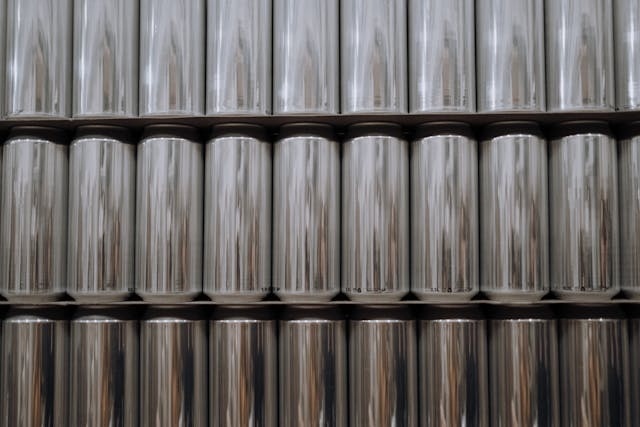
Key Challenges Unique to Aluminium
- Extreme grid variation: The same smelter can have a 10x difference in emissions depending on whether it uses coal-based or hydroelectric power
- Primary vs secondary divide: Production from virgin bauxite versus recycled scrap creates vastly different emission profiles
- PFC emissions: Anode effects release perfluorocarbons (CF₄ and C₂F₆) with extremely high global warming potential (6,500-9,200 times that of CO₂)
- Technology variation: Smelter designs play a major role in determining both direct and indirect emissions. Some plants have adopted newer technologies that cut carbon output considerably, while older ones remain highly intensive
Fertilisers CBAM Cost
Fertilisers present a unique challenge for CBAM importers. This is due to the variety of fertilisers covered under the mechanism, each with its own unique carbon-intensity characteristics. Around 2.6 tonnes of CO2e are produced per tonne of nitrogen-based fertiliser, while the production process for nitrogen-based fertilisers results in around 1.9 to 2.6 tonnes of CO2 emissions per tonne. This complexity means that CBAM costs will vary significantly depending on the specific fertiliser type and its production method.
Fertilisers Emissions Profile
Direct emissions (70-85% of total)
Most of the embedded carbon in fertilisers comes from the production of the base chemicals that go into making them. Ammonia production, for instance, uses steam methane reforming. This emits large amounts of CO₂. Nitric acid production, meanwhile, generates nitrous oxide (N₂O) - a gas that is around 265 times more potent than CO₂.
Indirect emissions (15-30% of total)
This figure is derived from the electricity used for the equipment used in fertiliser production, including compressors, pumps, fans and heat exchangers.
Key Challenges Unique to Fertilisers
- Multiple GHG types: Must track both CO₂ and N₂O, which requires different measurement approaches and conversion factors
- Feedstock vs fuel distinction: Natural gas serves dual purposes (as hydrogen feedstock for ammonia and as fuel for heat), requiring careful allocation
- Product-specific variations: Ammonia, urea, and nitric acid each have distinct emission profiles and calculation methodologies
- N₂O abatement verification: The effectiveness of catalytic reduction systems for nitric acid plants significantly impacts reported emissions
Does CBAM Cover Hydrogen?
Although CBAM covers hydrogen, the assessment of its emissions depends on the type of hydrogen produced. Each type of hydrogen, from turquoise hydrogen to blue hydrogen, has its own unique emissions profile (amounting to around 1.5-100% of the emissions total), making hydrogen one of the more difficult goods to calculate within the CBAM framework.
Hydrogen Emissions Profile
Direct emissions (10-100% of total)
The direct emissions of hydrogen cover a range of fuel sources and chemical processes. These include CO2 emissions from feedstock conversion, methane leakage that occurs during natural gas use, and CO2 emissions that result from carbon capture (CC) within blue hydrogen production.
Indirect emissions (0-90% of total)
These emissions occur off-site, primarily from the energy used to power the production facility. Their significance varies greatly. For green hydrogen, for instance, most of its indirect emissions are associated with the electricity used to power electrolysis, an essential stage in green hydrogen's production.
Key Challenges Unique to Hydrogen
- Production method diversity: Grey, blue, and green hydrogen have fundamentally different emission profiles, requiring distinct calculation approaches
- Feedstock accounting complexity: Natural gas serves as both an energy source and carbon/hydrogen feedstock in SMR, complicating emission attribution
- CCS effectiveness verification: For blue hydrogen, the carbon capture rate directly determines emissions (typical rates: 50-95% capture)
- Emerging technology standards: Green hydrogen via electrolysis is still developing standardised measurement protocols and grid attribution rules
CBAM Electricity Cost
Although affected by carbon pricing, the carbon cost of electricity is relatively simple to calculate. This is because, unlike other products within the framework, electricity doesn’t produce indirect emissions. Importers only have to report direct emissions in this case. However, tracing the origin of electricity, particularly where it is traded across borders, can be difficult, making tracking mechanisms to verify the electricity's source and CO2 intensity essential.
Electricity Emissions Profile
Direct emissions (100% of total)
Emissions are released at the point of generation. This may include power generated with fossil fuels or electricity generated from renewables. Electricity generated from renewable sources will have negligible or zero emissions. However, under CBAM rules, even zero – or close to zero emissions - must still be reported.
Indirect emissions (0% of total)
No indirect emissions are accounted for under the CBAM. Under the current framework, only direct emissions are calculated.
Key Challenges Unique to Electricity
- Origin Tracing: Pinpointing the actual generation source and its specific emission factor within complex, interconnected international power grids
- Flow Conflict: Reconciling emissions from physical energy flows versus those claimed under contractual agreements (e.g., Power Purchase Agreements)
- Time Specificity: Accounting for high emission variability based on the generation technology used and the exact time (time-of-day/year) electricity is imported
- Verification Gap: Providing verifiable proof for zero-emission sources (like solar or wind, backed by RECs) often requires developing robust, reliable tracking systems
CBAM Reporting: From Redtape to Strategic Advantage
CBAM, the first mechanism of its kind, aims to decarbonise high-polluting sectors and discourage carbon leakage. For importers, this creates the additional burden of calculating and reporting direct and indirect emissions.
However, by proactively identifying low-carbon suppliers, businesses can shape these regulatory changes to their advantage. By partnering with businesses that are serious about decarbonisation and dedicated to preventing carbon leakage, importers of CBAM goods can demonstrate their own climate commitments to their clients and stakeholders in turn.
To learn more about carbon reporting or to see how you can access CBAM certificates to continue importing covered goods in the future, contact our carbon team today.
About the author: CFP Energy
CFP Energy is a leading provider of energy transition services, working with large corporations across Europe and beyond. Our team provides access to renewable and transition fuels, carbon compliance services and long-term risk management solutions.
.jpg?width=110&height=82&name=luka-slapnicar-yqeXLR81Uj0-unsplash%20(1).jpg)
